Hi, I have an excel sheet with some details including Start date, end date, base currency (GBP) and local currency (USD,EUR etc). Im wanting to get an output with columns of Date,close FX rate, Base currency, Local currency. any help on how i can achieve this would be greatly appreciated.
For a deeper look into our Eikon Data API, look into:
Overview | Quickstart | Documentation | Downloads | Tutorials | Articles
38.1k
●69 ●35 ●53
I created an excel file with this information.
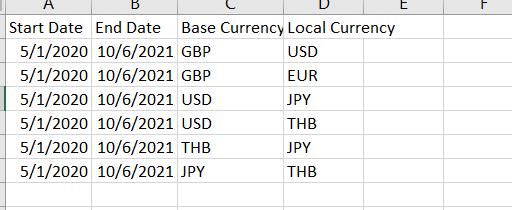
I used the openpyxl python package to load this excel file.
import pandas as pd
input_df = pd.read_excel(
     "forex.xlsx",
     engine='openpyxl',
)
Then, initialize the Eikon Data API.
import eikon as ek
ek.set_app_key('<App key>')
Next, I iterated all rows in the input_df data frame. For each row, I converted the base currency and local currency to a RIC. I am not sure about the RIC structure of currency RICs. I used the following methods.
- If a base currency is "GBP" and a local currency is "USD", RIC is "GBP="
- If a base currency is "USD", RIC is "<local currency>="
- If a base currency is not "USD", RIC is "<base currency><local currency>=R"
However, it is better to contact the content support team via MyRefinitiv regarding how to construct RICs from base currencies and local currencies.
Next, I called the get_timeseries method to get historical close prices and then added the returned data frame into an array.
df_array = []

for index, row in input_df.iterrows():
    ric = ''
    if row['Base Currency'] == 'GBP' and row['Local Currency'] == 'USD':
        ric = 'GBP='
    elif row['Base Currency'] == 'USD':
        ric = row['Local Currency']+"="
    else:
        ric = row['Base Currency']+row['Local Currency']+"=R"
    df = ek.get_timeseries(
        ric,
        start_date=row['Start Date'].strftime("%Y-%m-%d"),
        end_date=row['End Date'].strftime("%Y-%m-%d"),
        fields = ['CLOSE'],
        interval='daily')
    df['Base Currency'] = row['Base Currency']
    df['Local Currency'] = row['Local Currency']
    df_array.append(df.reset_index())
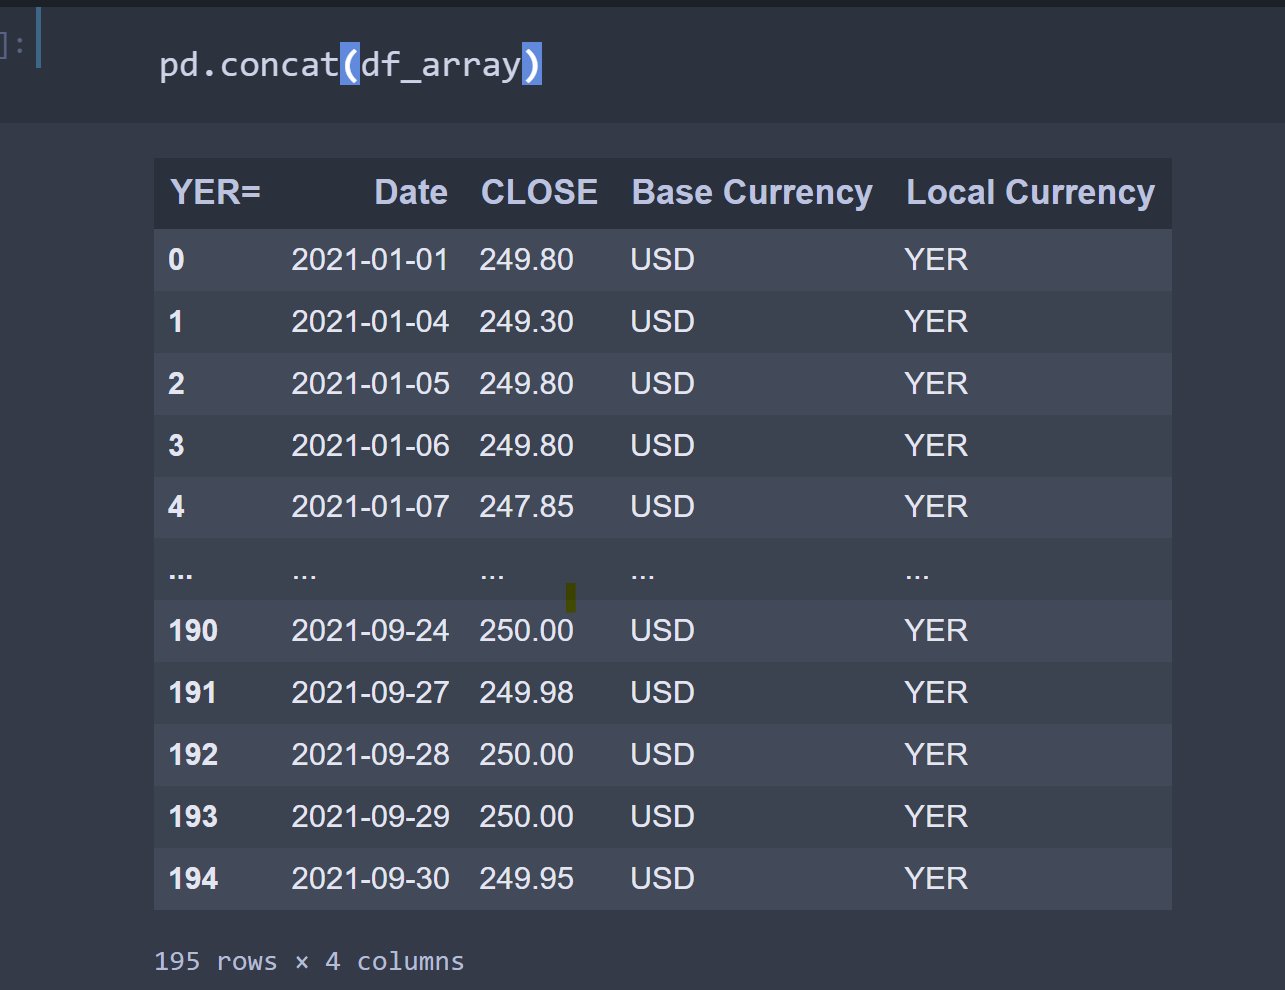
Finally, I called the concat method to concatenate pandas objects in the array.
pd.concat(df_array)
The output is:
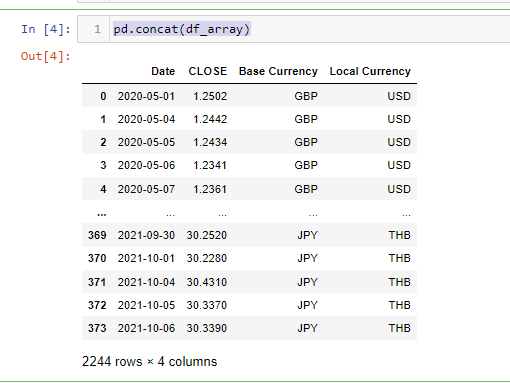
This is just a sample code. It doesn't cover all use-case scenarios. You need to test it before using it on production.

0
●0 ●1 ●2
@Jirapongse thank you so much for this! Although it seems to only output one currency for me?